Portable Weather Station Debut at Twin Cities Pride Festival
Jul 24, 2023
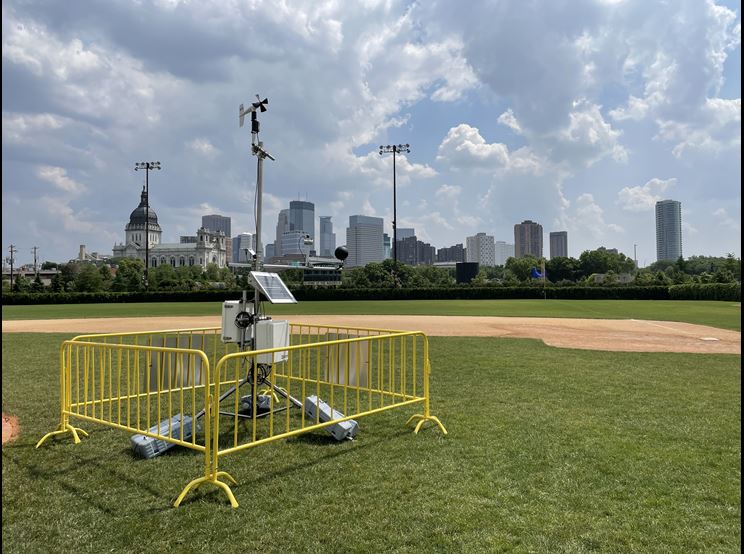
This year at the 2023 Twin Cities Pride Festival and Parade, the Hennepin County Emergency Management set up a temporary weather station next to the pitcher's mound at the Parade Stadium beside the Walker Art Center. This allowed emergency personal to monitor weather conditions in real time to warn festival officials for wind and heat concerns at the festival. Above is a visual of the station in Parade Stadium, with the Minneapolis skyline in the background. The station had an air temperature and relative humidity sensor, anemometer, barometer, black globe temperature sensor, and a pyranometer which gathered minute-by-minute data.
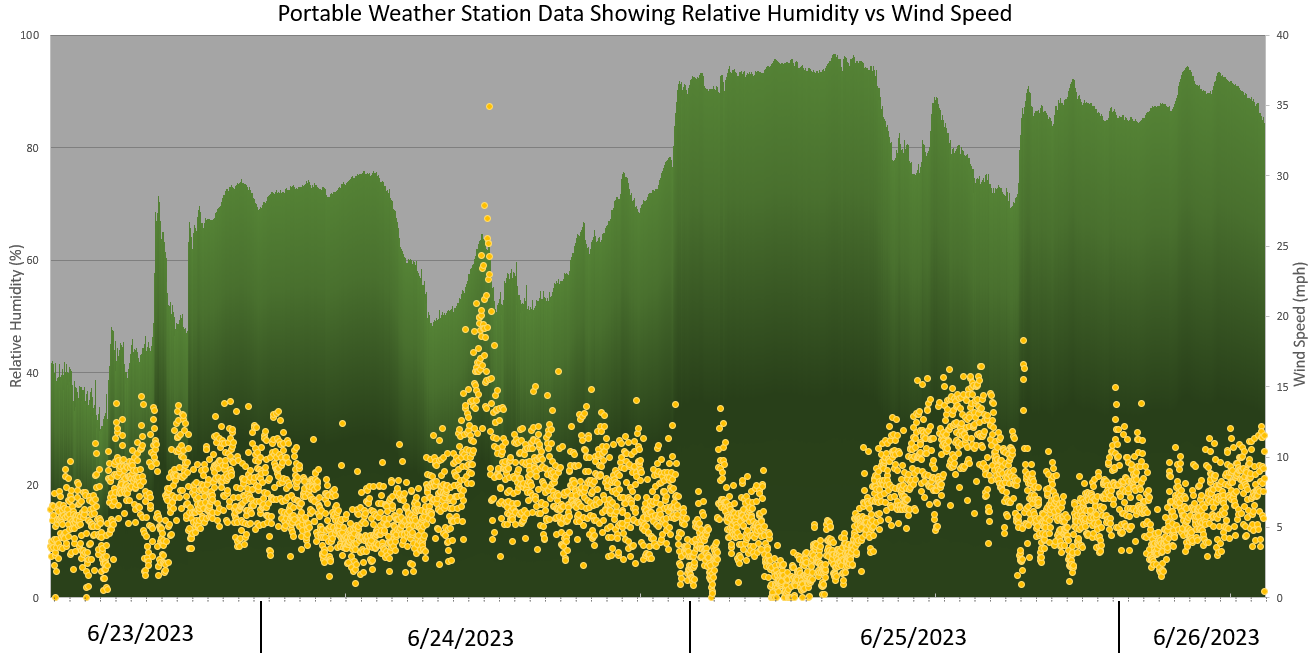
Shown here in green and yellow points are actual observations collected at the Pride Festival of relative humidity (RH) and wind speed respectively, with data collected from June 23rd through June 26th, 2023. This data was collected by the propeller anemometer and the air temperature and relative humidity sensor. The graphic shows when an outflow boundary hit the festival on Saturday, June 24th just before 1pm causing a slight increase in RH and the peak wind speed of the four day period (max speed of 34 mph at 12:48pm). The data also shows RH steadily increasing until late Saturday evening, when thunder showers moved into the Twin Cities.
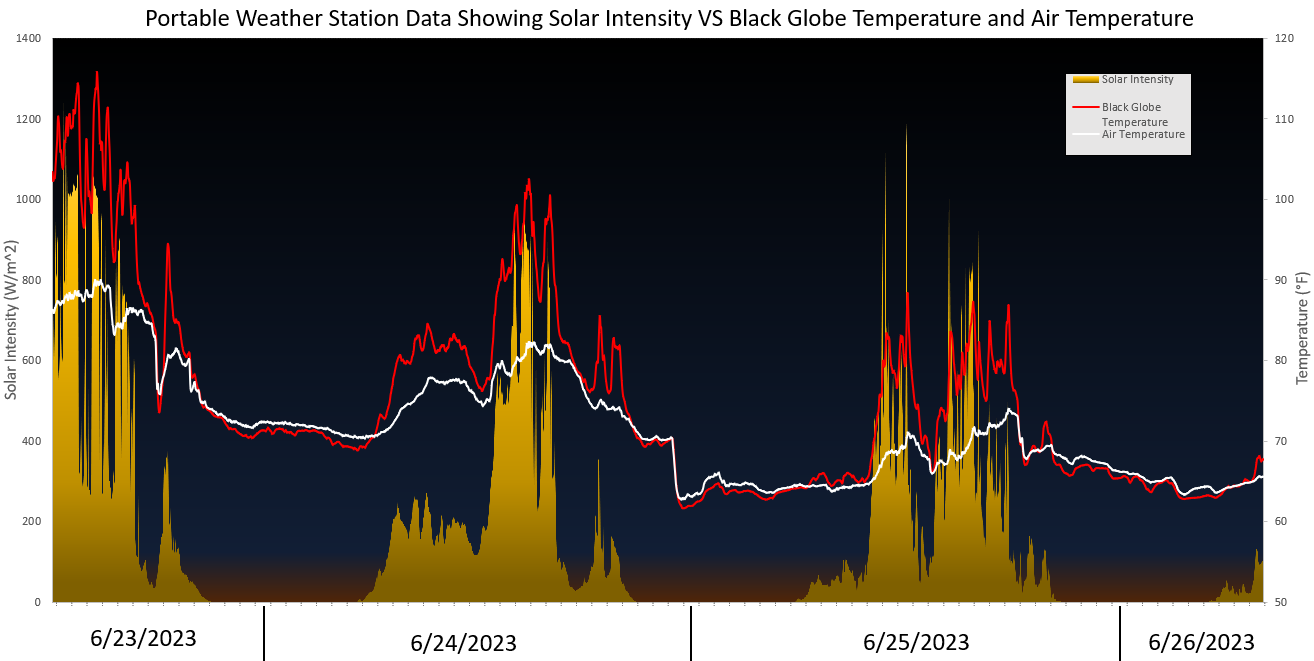
Shown above is data collected by the air temperature and relative humidity sensor, Black Globe Temperature sensor, and the pyranometer from June 23rd to June 26th, 2023. The Black Globe Temperature resembles conditions felt by the human body, so when the solar intensity is high (yellow columns), the Black Globe Temperature follows that and gives readings higher than the ambient air temperature. This data also shows cloud cover, as displayed on the 24th. The morning had cloudy skies with sun in the afternoon, which was echoed in the solar intensity of the day, with low solar intensity in the morning and high values in the later part of the day. Also take note that the evenings saw similar Black Globe Temperatures and ambient air temperatures. This is because there is a lack of incoming solar radiation, with Black Globe temperatures being below ambient air temperatures at times due to wind blowing across the instrument.